Loki, centralization of logs using the Prometheus way
Update helm installation instructions (04/05/2021).
This article is the translation of an original article of mine written in French. You can find the original article using the following link: https://linuxfr.org/news/loki-centralisation-de-logs-a-la-sauce-prometheus
This article is a quick introduction to Loki. This project is supported by Grafana and aims to centralize activity logs (servers or containers).
The main source of inspiration for Loki comes from Prometheus, with the idea of applying it to log management, the aim being to have the same mechanism:
- use of labels for data storage
- claim very few resources for its execution
In what follows, we will return to the operating principle of Prometheus and give some examples of use in the context of Kubernetes.
A word about Prometheus
In order to fully understand how Loki works, it is important to step back and have a little understanding of Prometheus.
The characteristic of this product is to retrieve metrics from collection points (using exporter) and store them in a TSDB (Time Series Data Base) by adding metadata in the form of labels.
Origin of need
In recent times, Prometheus has become a de facto standard in the world of Containers and Kubernetes: its installation is very simple and common cluster components natively offer Prometheus end-point. The Prometheus Engine is also able to retrieve labels from deployed containers. The monitoring of application consumptions is therefore very simple to implement.
Unfortunately, on the side of logs, there is still no turnkey method and the user must find his own solution:
- a managed centralized log service in the cloud (AWS, Azure, or Google)
- a monitoring service “monitoring as a service” (Datadog type)
- setting up a centralization service.
At the level of the third solution, I traditionally used to set up Elasticsearch engine — even if i have a set of reservations about it (especially its heaviness and the difficulty of its implementation).
Loki has been designed with the aim of simplifying this implementation by meeting the following criteria:
- be a simple product to start
- consume few resources
- operate alone without any special maintenance intervention
- to support the investigation in addition to Prometheus in case of bug
However, this lightness is at the price of some compromises. One of them is to not index the content. The search for text is therefore not very efficient or rich in this respect and does not allow statistics to be made on the content of the text. But since Loki wants to be an equivalent of grep and must serve as a complement to Prometheus, this defect is not one.
Incident Resolution Method
To better understand how Loki does not need indexing, let’s go back to the method used by Loki designers with the following schema:
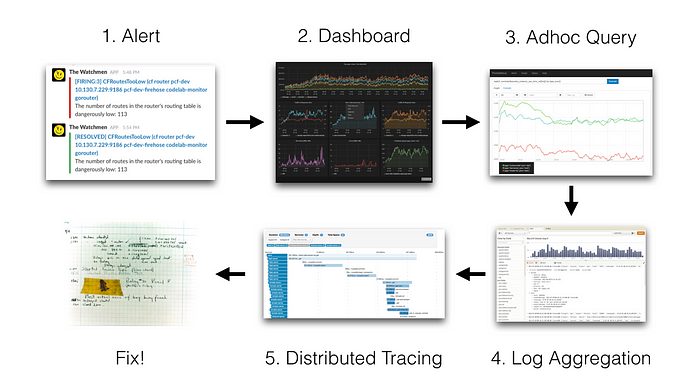
Incident Resolution Method
The idea is to start from an alert source (Slack notification, SMS, etc.). The person in charge of the follow-up then makes the following step:
- consulting Grafana dashboards
- look up raw metrics (in Prometheus, for example)
- consultation of logs entries (Elasticsearch, for example)
- possibly, consultation of the distributed traces (Jaeger, Zipkin, etc.)
- finally, correction of the original problem.
Here, in the case of Grafana + Prometheus + Elasticsearch + Zipkin stack, the user will need to change tools four times. In order to reduce intervention times, the idea is to do everything with one tool: Grafana. It should be noted that Grafana has been proposing this notion of exploration since version 6. It thus becomes possible to consult Raw data from Prometheus directly from Grafana.
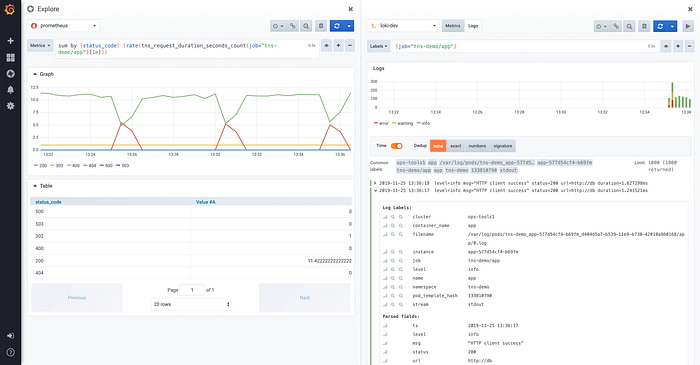
From this screen, it is possible to consult the Loki logs associated with Prometheus metrics, in particular by using the concept of cutting the screen. Since 6.5, Grafana allow to handle trace id in Loki log entries and let you follow links to go to your favorite distributed tracing tools (Jaeger).
Local Loki test
The easiest way to test Loki locally is to go through the docker-compose tool. The docker-compose file is located on the Loki repository. The recovery of the content of this repository is done using the following git command:
$ git clone https://github.com/grafana/loki.gitThen you have to go to the production directory:
$ cd productionFrom here it is possible to get the latest version of Docker images:
$ docker-compose pullFinally, the Loki stack starts with the following command:
$ docker-compose upLoki Architecture
Here is a small diagram of Loki principle:
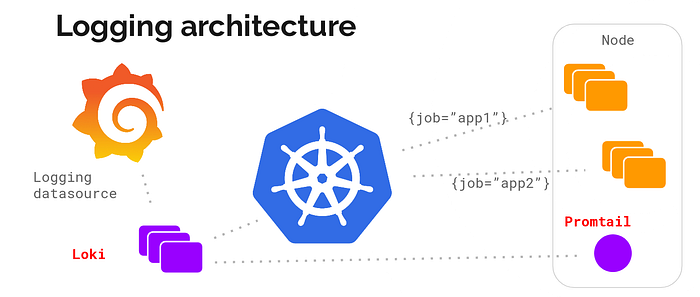
A Web client runs applications on the server, Promtail collects the logs it sends to Loki, the Web client also sends metadata to Loki. Loki aggregates everything. Then data can be transmited to Grafana.
Loki is started. To view the components present, run the following command:
$ docker psIn the case of a freshly installed Docker daemon, the command must then return the following output:
IMAGE               PORTS                  NAMES
grafana/promtail:                          production_promtail_1
grafana/grafana: m  0.0.0.0:3000->3000/tcp production_grafana_1
grafana/loki: late  80/tcp,0.0.0.0:3100... production_loki_1
We find the following bricks:
- Promtail: an agent that supports log centralization (Promtail, for Tailing logs in Prometheus format)
- Grafana: the famous data layout tool
- Loki: the data centralization daemon
As part of a classic infrastructure installation (based on virtual machines for example), the Promtail agent must be deployed on each machine. Grafana and Loki can possibly be installed on the same machine.
Deployment in Kubernetes
The installation of Loki bricks in Kubernetes will be based on the following:
- a daemonSet to deploy the Promtail Agent on each machine in the server cluster
- a deployment (Deployment) to deploy the Loki part
- and a last deployment for Grafana.
Fortunately, Loki is available as a Helm package to simplify its deployment.
Helm installation
For the rest, the user must have the command helm. The latter is recovered on the GitHub repository of the project. Instructs the user to decompress the archive corresponding to the architecture of the user’s workstation and place the helm command in $PATH.
Note: Version 3.0.0 of Helm has just been released. Since it changes a lot, the reader is advised to wait a bit before getting started.
Adding the Helm source
The first step will be to add the “loki” repository using the following command:
$ helm repo add grafana https://grafana.github.io/helm-chartsOnce this command is launched, it becomes possible to search for packages with the name “loki”:
$ helm search repo lokiBelow is an example of returned result:
grafana/loki       2.5.0 v2.2.0 Loki: like Prometheus, but for logs.
...
grafana/loki-stack 2.3.1 v2.1.0 Loki: like Prometheus, but for logs.
These packages have different functions:
- the grafana/loki package corresponds to the Loki server alone
- the grafana/loki-stack package allowing you to deploy Loki and Promtail in one go.
Deploying Loki
To deploy Loki in Kubernetes, in the “monitoring” namespace, run the following command:
$ helm upgrade --install loki grafana/loki-stack \
               --namespace monitoring
To have persistent disk space, add the option --set loki.persistence.enabled=true:
$ helm upgrade --install loki grafana/loki-stack \
               --namespace monitoring \
               --set loki.persistence.enabled=true
Note: in case you want to deploy Grafana at the same time, add the option --set grafana.enabled=true
When launching this command, the user should get the following output:
LAST DEPLOYED: Tue Nov 19 15:56:54 2019
NAMESPACE: monitoring
STATUS: DEPLOYEDRESOURCES:
==> v1/ClusterRole
NAME AGE
loki-promtail-clusterrole 189d…NOTES:
The Loki stack has been deployed to your cluster. Loki can now be added as a datasource in Grafana.See http://docs.grafana.org/features/datasources/loki/ for more details.
A glance at the status of pods in the “monitoring” namespace will tell us everything is deployed:
$ kubectl -n monitoring get pods -l release=lokiBelow is an example of returned results:
NAME                 READY  STATUS   RESTARTS  AGE
loki-0               1/1    Running  0         147m
loki-promtail-9zjvc  1/1    Running  0         3h25m
loki-promtail-f6brf  1/1    Running  0         11h
loki-promtail-hdcj7  1/1    Running  0         3h23m
loki-promtail-jbqhc  1/1    Running  0         11h
loki-promtail-mj642  1/1    Running  0         62m
loki-promtail-nm64g  1/1    Running  0         24m
All pods are started. Now it’s time to do some tests!
Connection to Grafana
Under Kubernetes, in order to connect to Grafana, it is necessary to open a tunnel to his pod. Below is the command to open port 3000 to the Grafana pod:
$ kubectl -n monitoring port-forward svc/loki-grafana 3000:80Another important point is the need to recover the password of the administrator of Grafana. The latter is stored in the loki-grafana secret in the .data.admin-user field in the base64 format.
To recover it, run the following command:
$ kubectl -n monitoring get secret loki-grafana \
  --template '{{index .data "admin-password" | base64decode}}'; echo
Use this password in conjunction with the default admin account (admin).
Definition of the Loki data source from Grafana
First thing first, make sure that the Loki data source is present (go to the following location: Configuration / Datasource).
Here is an example of a valid definition:
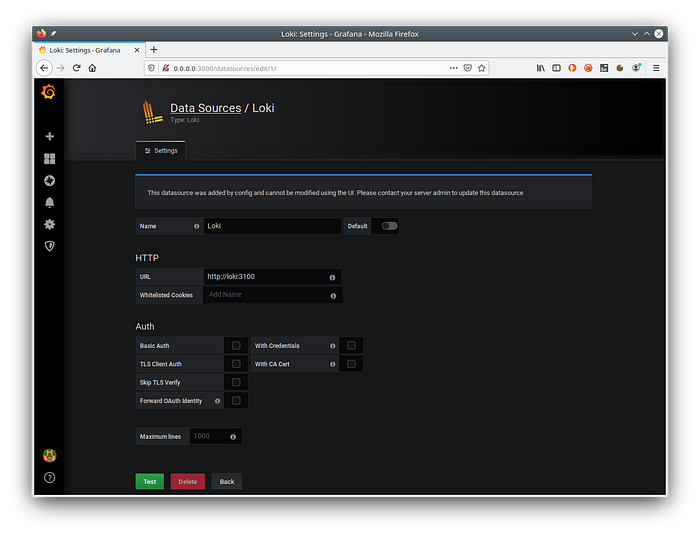
Clicking on the Test button will ensure that communication with Loki is going well.
Querying the Loki engine
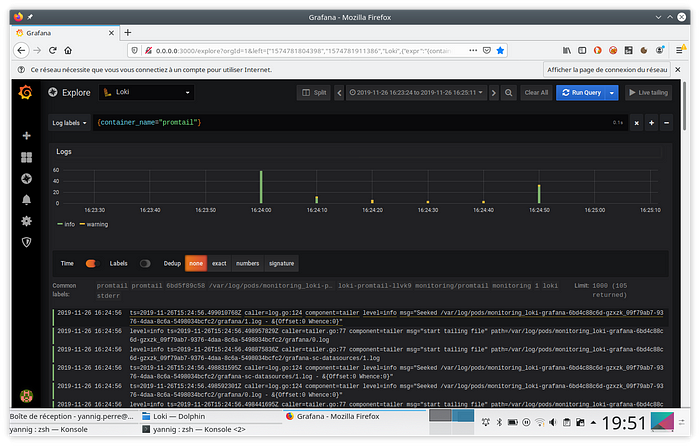
Go now to Grafana’s “Explore” field. When ingesting the container logs, Loki is responsible for adding the annotations from Kubernetes. It thus becomes possible to use it to retrieve logs from a specific container.
Thus, to select the promtail container logs, the request to enter will be as follows: {container_name="promtail"}.
Also remember to select the Loki data source.
This query will then return the activity of these containers in the following form:
Inclusion in a dashboard
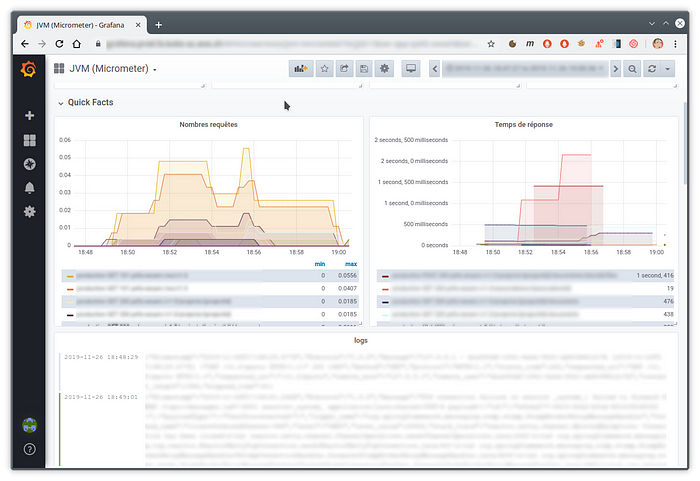
Since Grafana 6.4, it is possible to include log extraction directly in a Grafana dashboard. The user can then quickly switch between requests count of his site with the traces returned by his application.
Below is an example of a dashboard realizing this mixture:
Loki’s future
When I started using this product back in may/june, Loki version 0.1 was just about to be released. Now, the release of version 1.0 was just released a few days ago followed by 1.1 and 1.2. :)
I started using it from version 0.1 and it must be admitted that at the time stability was not there yet. Overall, version 0.3 brought real signs of maturity and the following versions (0.4, then 1.0) only reinforced this impression.
From now on, with version 1.0.0, no one should have any excuse for not using this great tool.
The most interesting works should no longer take place on Loki but more on integration with the excellent Grafana. Indeed, version 6.4 of Grafana has brought good integration with the dashboards.
Version 6.5, which has just been released, further improves this integration by automatically converting the content of the log line when it is in JSON format.
Below a small video presenting this mechanism:
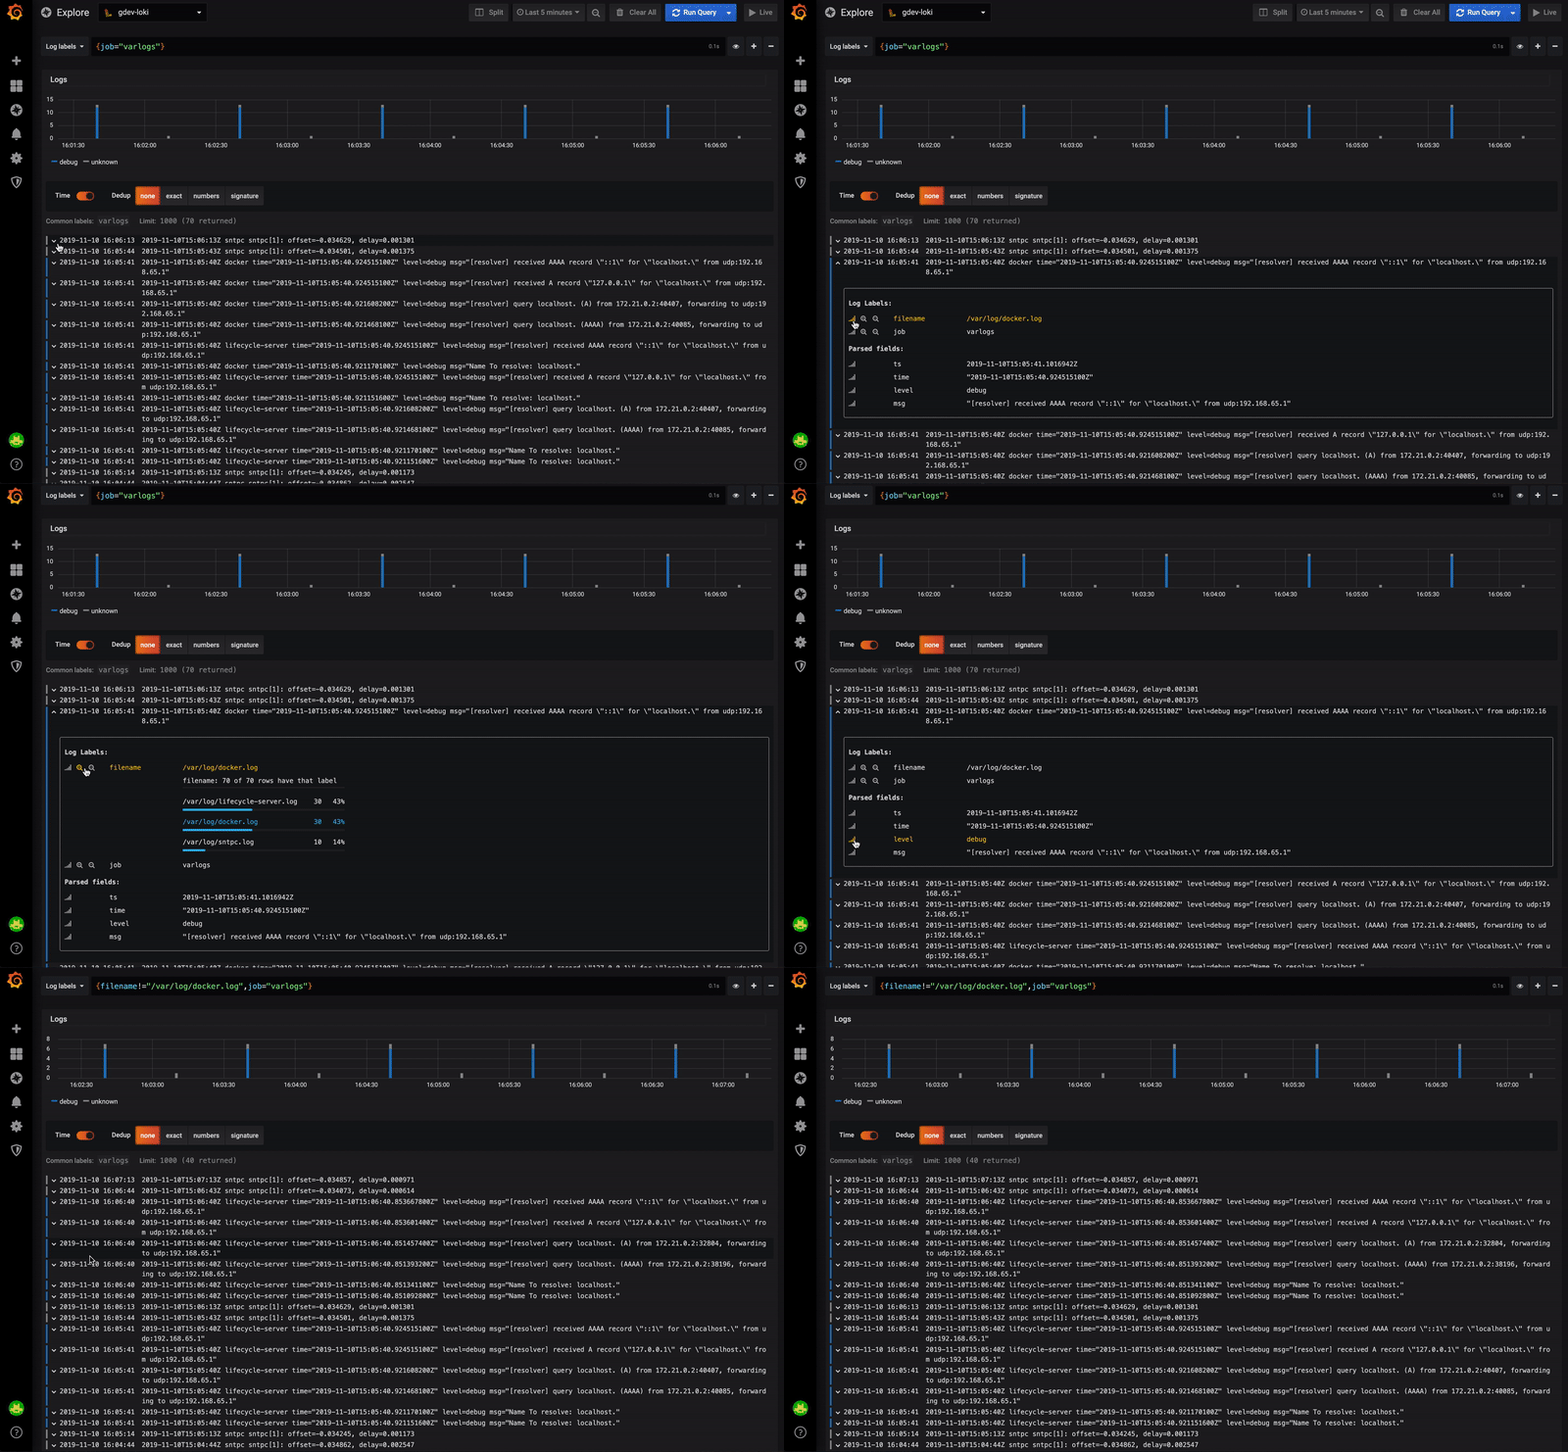
It also becomes possible to use one of the fields of the JSON structure for example:
- point to an external tool
- filter the contents of the logs
You can then click on the traceId field to point to a Zipkin or Jaeger dashboard.
